Setting up your financial reports? Sinéad Brennan and Andrew Faulkner from AccountsIQ share the essential pre-prep stages and steps you won't want to miss.

Charity finances are always under scrutiny. Everyone across the organisation – from budget holders to trustees – has different reporting demands and expectations. This article looks at how your teams can get the reports and data they need.
1. Work out where you are with your current reporting and where you want to be
Sinéad believes your first move should be to step back and conduct a thorough audit of your current reporting. Then you can map out your ideal reporting scenario to identify any gaps. If that sounds daunting, Andrew has a simple way to get started:
“I’ve found that many charities start this process by asking:
- What work are we currently doing in Excel?
- What reports are we running manually to provide the data our organisation needs?
- What reports are we missing; where are our blind spots across the organisation?
“The chances are, you could do just about all your reporting with very little, if any, manual work.”
2. What business intelligence does the wider organisation need?
This process should involve bringing everybody together to brainstorm what business intelligence is most important for your organisation.
“There’s definitely an element of change management about getting your reporting right,” explains Sinéad. “It’s a great opportunity to bring everyone together in a workshop to plan what your ideal scenario would be. You get to rethink your reporting needs rather than jumping in and changing your processes, or just adding to what you already have.”
Don’t limit yourself to just looking at the financial reports. Instead, consider what reports each department and stakeholder would have in an ideal world? It’s also important to remember that people consume information in different ways.
For example, finance managers tend to want granular detail. Other audiences, such as department managers or trustees, might just want simple, visual management packs with some high-level charts. If you’re dealing with donors and grant funding, you’ll need to demonstrate efficiencies.
Other factors to consider might be how your teams operate internationally. Perhaps they are in parts of the world where internet bandwidth can be volatile, or maybe you have system users who are not qualified accountants. You’ll need to take all these factors into account when you audit your organisation’s reporting requirements.
Other departments will be much more willing to engage with this process once they understand how it’s going to benefit them. Andrew recommends emphasising the following key benefits to your non-finance colleagues:
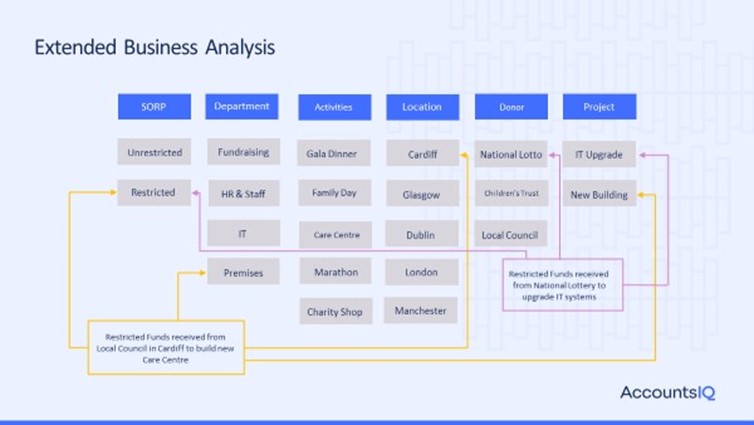
- Better financial visibility and insights: multi-dimensional reports can be segmented by restricted/unrestricted funds, individual projects, revenue streams or services. They’ll be able to quickly track spending against budget, not just actual spend, at any time.
- More autonomy: with access to certain parts of the finance system, they won’t need to keep emailing finance every time they need information on their department’s spend or to analyse their income streams.
Here’s an example of how your charity’s business analysis could work in AccountsIQ:
Customer story: Welsh Council for Voluntary Associations (WCVA)
Tracey Marsh, Finance Director with WCVA, wanted their budget holders to be more self-sufficient. They have around 40 system users. Five are finance team members and the others are set up as lite business users with the ability to manage approvals and access certain reports.
Like many non-profits, WCVA uses AccountsIQ’s BI codes and multi-dimensional reporting to manage their complex accounting and reporting needs.
“One of our dimensions is used to distinguish between restricted and unrestricted funds. Then we have lots of projects to which we allocate salaries and other costs; that’s another list of dimensions.
"We’ve also created other dimensions so we can deliver detailed reports to our trustees that show exactly what each project is contributing to the organisation. Once we've closed the accounts, I can just run this multiple KPI report for the trustees. I used to have to do that manually.”
WCVA’s finance team have also created their Chart of Accounts in AccountsIQ to align with their SORP reporting.
Find out more at this webinar on 28 September
“None of the charities we have supported through the process of setting up their reporting has been the same,” concludes Sinéad. “We work with each one to design their Chart of Accounts and coding structure to meet their specific needs. It’s a highly collaborative process; we combine your knowledge of your charity with our knowledge of the system architecture to make recommendations.
“For example, you can use the Reporting Manager function. But, in my experience, a great many of the reports you need come from the GL Explorer. We go through all the options in the design phase and each charity selects what they need for their different stakeholders.
“The process always involves testing all the reports before you go live. If they don’t hit the mark, we go again. For example, we might need to tweak the Chart of Accounts or coding structure to get to the end goal. But we do get there.”
If you’d like to hear more on this topic from Sinéad and Andrew, you can register for their free webinar on 28 September. They’ll be looking at reporting as part of the wider topic of How healthy is your Chart of Accounts?
Sinéad Brennan is Head of Onboarding and Andrew Faulkner is Business Development Manager at Cloud accounting software provider AccountsIQ.